The CDNX Has Reached a Critical Turning Point Again
When I first began writing about the S&P/TSX Venture Composite Index (CDNX), I argued that the index had completed one of the longest and most frustrating bear markets in its history. I suggested the decline had been followed by a large accumulation pattern that pointed to substantially higher prices over time.
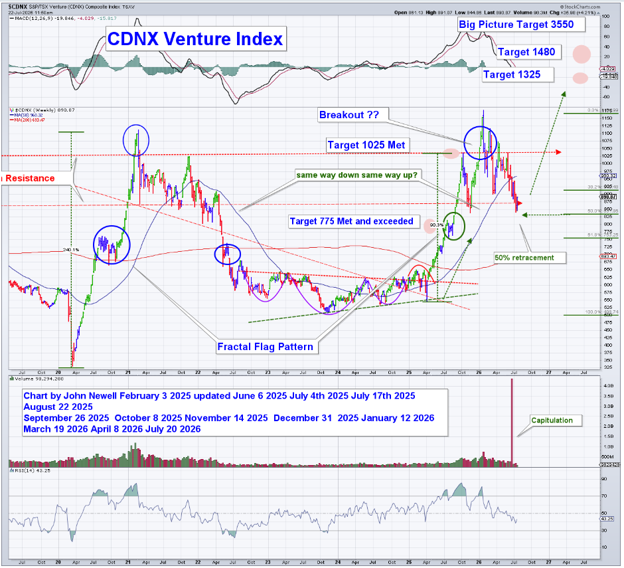
Since then, the market has done exactly what I expected. It broke through long term resistance, reached my first objective near 775, continued through my next target around 1025, and for the first time in years, investors were once again talking about junior mining stocks.
Markets rarely move in a straight line, however.
After reaching the 1025 area, the CDNX finally encountered meaningful selling pressure and began a well-deserved correction. From a technical perspective, I don't find this surprising at all. In fact, I believe this correction was both necessary and healthy.
A Classic 50% Retracement
One of the first areas I look at during any correction is the Fibonacci retracement levels. Markets often retrace approximately 38.2%, 50%, or 61.8% of a major advance before the primary trend resumes.
In this case, the CDNX has now corrected almost precisely to the 50% retracement of the rally from the 2024 lows to the recent 2026 highs.
That level also coincides with previous breakout support, making it a logical area where buyers would be expected to step back into the market.
When several technical factors converge at the same price level, I pay attention.
Capitulation May Have Marked the Low
Perhaps the most encouraging development wasn't simply the retracement itself.
It was how the correction ended.
Last Friday, the index experienced what appears to be a classic selling climax. Volume exploded as weak holders rushed for the exits while prices briefly broke lower before recovering. This type of emotional washout is exactly what I often see near important intermediate lows.
Corrections usually don't end because everyone suddenly becomes optimistic.
They end because the last discouraged sellers finally give up.
That appears to be what happened here.
While no technical analyst can ever guarantee a bottom, I believe the evidence now strongly suggests that at least a tradable low has likely been established.
The Larger Pattern Remains Intact
What continues to impress me is that the bigger technical picture hasn't changed.
The large fractal continuation pattern I identified many months ago remains intact.
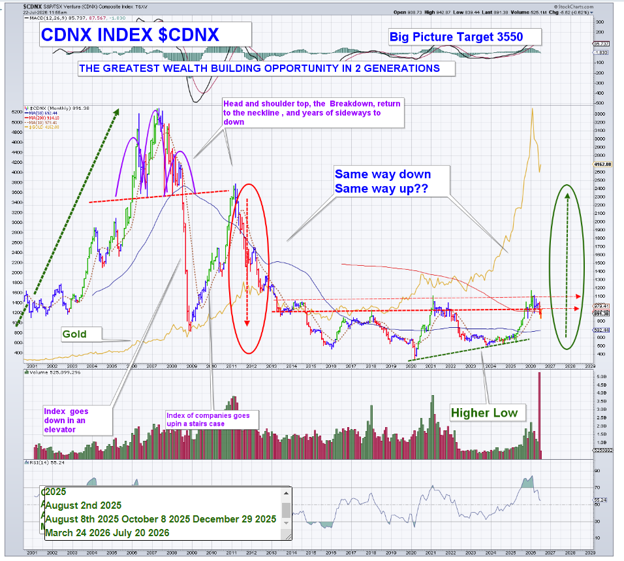
The "same way down, same way up" concept that I've discussed repeatedly continues to unfold remarkably well. The violent decline from the 2021 highs is now being matched by an orderly rebuilding process that continues to produce higher highs and higher lows.
This latest correction has not damaged that structure.
If anything, it has strengthened it.
The index has simply retraced, consolidated gains, and returned to an area where longer term buyers can begin accumulating positions again.
Watching for the Next Breakout
The next hurdle remains the previous resistance zone around 1025.
A convincing move back above that level would suggest the correction has fully run its course and would put my next upside objectives near 1325 and eventually 1480 back into focus.
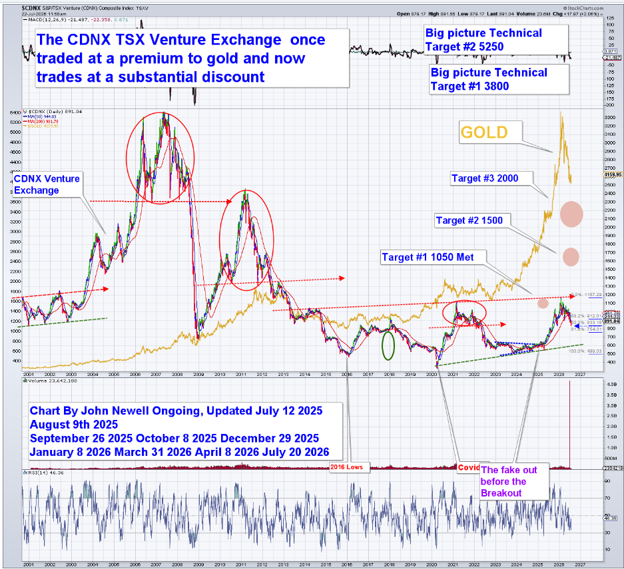
Beyond those levels, my long term target remains approximately 3550, representing a full recovery toward the area where this secular bear market began more than a decade ago.
That may sound ambitious today.
It sounded ambitious when I first published a target of 775 as well.
The market reached it.
Then it exceeded it.
Why This Matters
The CDNX remains the most relevant index for tracking Canada's junior mining sector. Unlike the senior gold indices, the Venture Exchange reflects where exploration capital is flowing and where new discoveries are financed.
When this index strengthens, financing becomes easier, drilling programs accelerate, mergers and acquisitions increase, and investor interest returns throughout the exploration sector.
That is why I spend so much time following this chart.
I believe the recent correction has shaken out speculative excess while preserving the larger bull market structure.
For me, this isn't a chart showing weakness.
It's a chart showing a bull market taking a well advertised pause before attempting its next advance.
As always, the market will have the final say, but based on what I see today, I believe the odds now favor that a meaningful tradable low has been established, and I will be watching closely for confirmation that the next leg of this bull market is beginning.
By John Newell July 20 2026